Horizontal jet in coflow
A horizontal jet is released into a current, which is in the same direction
as the pipe outlet. The ambient current velocity is zero initially, but
increases to 0.1 m/s after one hour.
The config.toml file looks like this:
# Characteristics of the pipe and the effluent flow
[pipe]
time = [1970-01-01]
flow = [0.2]
dens = [1000]
diam = [0.5]
depth = [100]
decline = [0]

# Characteristics of the ambient water masses
[ambient]
time = [1970-01-01T01:00:00, 1970-01-01T02:00:00]
depth = [100]
coflow = [[0], [0.2]]
crossflow = [[0], [0]]
dens = [[1000], [1000]]

# Output options
[output]
csv.file = "out.csv"
csv.float_format = "%.6g"
trajectory.step = 5           # Time between trajectory points [s]
trajectory.stop = 30          # Time of final trajectory point [s]
release.start = 1970-01-01T01:00:00    # Time of first release [date]
release.stop = 1970-01-01T02:00:00     # Time of final release [date]
release.step = 3600           # Time between releases [s]
The contents of the output file out.csv is:
release_time,t,x,y,z,u,v,w,density,radius,dilution
1970-01-01 01:00:00,0,0,0,100,1.01859,0,0,1000,0.25,1
1970-01-01 01:00:00,5,2.67114,0,100,0.362106,0,0,1000,0.704095,2.81979
1970-01-01 01:00:00,10,4.20059,0,100,0.264651,0,0,1000,0.964101,3.864
1970-01-01 01:00:00,15,5.39823,0,100,0.218734,0,0,1000,1.1677,4.68487
1970-01-01 01:00:00,20,6.41637,0,100,0.190506,0,0,1000,1.34078,5.37954
1970-01-01 01:00:00,25,7.31774,0,100,0.171126,0,0,1000,1.49402,5.99992
1970-01-01 01:00:00,30,8.13534,0,100,0.156561,0,0,1000,1.63301,6.55811
1970-01-01 02:00:00,0,0,0,100,1.01859,0,0,1000,0.25,1
1970-01-01 02:00:00,5,3.15721,0,100,0.484053,0,0,1000,0.616726,2.892
1970-01-01 02:00:00,10,5.32823,0,100,0.397848,0,0,1000,0.8158,4.15915
1970-01-01 02:00:00,15,7.20654,0,100,0.3576,0,0,1000,0.965112,5.23205
1970-01-01 02:00:00,20,8.92934,0,100,0.333105,0,0,1000,1.08799,6.1937
1970-01-01 02:00:00,25,10.5509,0,100,0.316532,0,0,1000,1.19365,7.0842
1970-01-01 02:00:00,30,12.1017,0,100,0.304393,0,0,1000,1.28729,7.9233
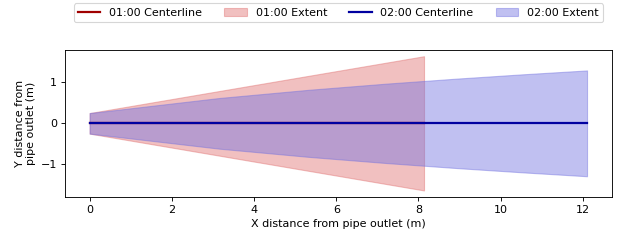
To visualize the effect of the ambient flow, we plot a horizontal cross-section of the plume at two points in time: Both initially (when the ambient is stagnant) and after one hour (when there is an ambient current).
import matplotlib.pyplot as plt
import pandas as pd

df_all = pd.read_csv("out.csv").groupby('release_time')
dates = ['1970-01-01 01:00:00', '1970-01-01 02:00:00']
fcolors = ["#e0707070", "#7070e070"]
ecolors = ["#a00000", "#0000a0"]

for date, fcolor, ecolor in zip(dates, fcolors, ecolors):
    df = df_all.get_group(date)

    # Compute trajectory of centerline and plume edges
    r = df.radius.values
    x = df.x.values
    y = df.y.values
    y1 = y - r
    y2 = y + r

    plt.plot(
        x, y,
        color=ecolor,
        linewidth=2,
        label=f'{date[-8:-3]} Centerline',
    )
    plt.fill_between(
        x, y1, y2,
        color=fcolor,
        label=f'{date[-8:-3]} Extent',
    )

plt.xlabel('X distance from pipe outlet (m)')
plt.ylabel('Y distance from\npipe outlet (m)')
plt.gca().set_aspect('equal')
plt.legend(loc='upper center', bbox_to_anchor=(0.5, 1.35), ncol=5)
plt.gcf().set_size_inches(8, 3)
plt.tight_layout()